Unfortunately my internet provider (UPS CH) has intermittent failures. After switching to my own WiFi router, I decided to set up monitoring around my home internet connection to see the real impact.
The setup will consist of a Prometheus instance, ping and SNMP monitoring targets and Grafana for visualization.
Installing Prometheus
The standard install guide is quite generic. What I wanted, was a Prometheus setup with Docker and the standard Systemd files.
First, let’s create a data directory on the host to keep Prometheus data safe in-between restarts of the container (see here). As Prometheus runs as nobody user within the container, the permissions need to match:
sudo mkdir /var/lib/prometheus
sudo chown 65534:65534 /var/lib/prometheus
Now for the main config file of prometheus, let’s put it in /etc/prometheus/prometheus.yml
global:
  scrape_interval:     15s # By default, scrape targets every 15 seconds.

  # Attach these labels to any time series or alerts when communicating with
  # external systems (federation, remote storage, Alertmanager).
  external_labels:
    monitor: 'codelab-monitor'

# A scrape configuration containing exactly one endpoint to scrape:
# Here it's Prometheus itself.
scrape_configs:
  # The job name is added as a label `job=<job_name>` to any timeseries scraped from this config.
  - job_name: 'prometheus'

    # Override the global default and scrape targets from this job every 5 seconds.
    scrape_interval: 5s

    static_configs:
      - targets: ['localhost:9090']
Now for the systemd file that Prometheus will use.
[Unit]
Description=Prometheus
After=docker.service network-online.target

[Service]
Restart=always
ExecStart=/usr/bin/docker run \
    --name="prometheus" \
    --init \
    --attach stderr --attach stdout \
    --rm \
    --volume /etc/prometheus/prometheus.yml:/etc/prometheus/prometheus.yml \
    --volume /var/lib/prometheus:/prometheus \
    --net=host \
      prom/prometheus:v2.20.1
Restart=always
ExecStop=/usr/bin/docker stop -t 5 prometheus

[Install]
WantedBy=multi-user.target
Then obviously run it:
systemd daemon-reload
systemd start promethues
Adding exporters
Prometheus itself is just a monitoring system, we need to give it something to monitor data from. For that we need an exporter that will actually do the work of gathering data and making it available to Prometheus. In my case, we will use two exporters: a ping exporter to monitor latency to well known services (Google and Cloudflare) and an SNMP exporter to take data off my AsusWRT Merlin router.
Ping Exporter
This is a program that will constantly ping define endpoints and export them for Prometheus to scrape and retain. There are many available, but (knsd/ping-exporter)[https://github.com/knsd/ping-exporter] looked the best after a 1 minute search on Google.
The systemd config to run it would look something like:
[Unit]
Description=Prometheus Ping Exporter
After=docker.service network-online.target

[Service]
Restart=always
ExecStart=/usr/bin/docker run \
    --name="prometheus-pingexporter" \
    --init \
    --attach stderr --attach stdout \
    --rm \
    -p 9346:9346 \
        knsdnet/ping-exporter:0.3.1
Restart=always
ExecStop=/usr/bin/docker stop -t 5 prometheus-pingexporter

[Install]
WantedBy=multi-user.target
After that do the typical system startup and check whether things come up on 127.0.0.1:9346.
Add this to the /etc/prometheus/prometheus.yml to the scrape_configs section
scrape_configs:
  - job_name: 'ping'
    metrics_path: /ping
    static_configs:
      - targets:
        - 1.1.1.1
        - 8.8.8.8
    relabel_configs:
      - source_labels: [__address__]
        target_label: __param_target
      - source_labels: [__param_target]
        target_label: instance
      - target_label: __address__
        replacement: 127.0.0.1:9346 # This exporter's real hostname:port
SNMP Exporter
My WiFi router (running AsusWrt Merlin) has SNMP enabled. To get started, one needs to make sure to enable SNMP on the router and set its RO community (a.k.a. password) to public. SNMP is not the most secure protocol, so make sure to keep it on a trusted network.
The most interesting data I want to get off the router is the up- and down-link bandwidth for my WAN port (connection to internet), my wired devices, my trusted and guest WiFi networks.
[Unit]
Description=Prometheus SNMP Exporter
After=docker.service network-online.target

[Service]
Restart=always
ExecStart=/usr/bin/docker run \
    --name="prometheus-snmpexporter" \
    --init \
    --attach stderr --attach stdout \
    --rm \
    -p 9116:9116 \
        prom/snmp-exporter:v0.18.0
Restart=always
ExecStop=/usr/bin/docker stop -t 5 prometheus-snmpexporter

[Install]
WantedBy=multi-user.target
And the relevant Prometheus config
scrape_configs:
  - job_name: 'snmp'
    static_configs:
      - targets:
        - 192.168.1.1  # SNMP device.
    metrics_path: /snmp
    params:
      module: [ddwrt]
    relabel_configs:
      - source_labels: [__address__]
        target_label: __param_target
      - source_labels: [__param_target]
        target_label: instance
      - target_label: __address__
        replacement: 127.0.0.1:9116  # The SNMP exporter's real hostname:port.
Installing Grafana
As before, we’ll be setting up Grafana as a docker container with systemd. Doing simple docker, without the docker compose, docker swarm, or other bells and wistles is not well documented. Standard documentation (here) and here) will be useful but will require tweaking.
Grafana persists data between restarts, so let’s create it some space to do so (with the in-contianer user 472 that Grafana uses):
sudo mkdir /var/lib/grafana
sudo chown 472:472 /var/lib/grafana
We’ll also need a config file directory:
sudo mkdir /etc/grafana
sudo touch /etc/grafana/grafana.ini
sudo touch /etc/grafana/grafana.env
Now let’s put this together in systemd:
[Unit]
Description=Grafana
After=docker.service network-online.target

[Service]
Restart=always
ExecStart=/usr/bin/docker run \
    --name="grafana" \
    --init \
    --attach stderr --attach stdout \
    --rm \
    --env-file=/etc/grafana/grafana.env  \
    -e "GF_LOG_MODE=console file" \
    --volume /etc/grafana/grafana.ini:/etc/grafana/grafana.ini \
    --volume /var/lib/grafana:/var/lib/grafana \
    --net=host \
      grafana/grafana:7.1.3
Restart=always
ExecStop=/usr/bin/docker stop -t 5 grafana

[Install]
WantedBy=multi-user.target
Auth access
If you decided to use Traefik as a proxy, for example as part of the wiregate setup described in a previous post, you may want to use it as a frontend that does authentication. In that setup, we used Google auth to authenticate users at the proxy to allow them access to resources behind it.
With Grafana, you can use a HTTP header from a proxy to auto-create users (see documentation).
For that, you need to augment the ForwardAuth parameter of authResponseHeader.
If you want to troubleshoot what exactly Traefik sends to Grafana, stop Grafana using sudo systemctl stop grafan and then
$ sudo nc -l 3000
(...)
X-Forwarded-Host: grafana.example.com
X-Forwarded-Port: 443
X-Forwarded-Proto: https
X-Forwarded-Server: wiregate
X-Forwarded-User: example@gmail.com
This means our header is X-Forwarded-User so we’ll just gonna use that in our grafana.ini:
[users]
allow_sign_up = false
auto_assign_org = true
auto_assign_org_role = Editor

[auth.proxy]
enabled = true
header_name = X-Auth-User
header_property = email
auto_sign_up = true
Adding dashboards and graphs
Now comes the fun part, actually making the data useful.
A note about histograms
The knsd/ping-exporter uses histograms. Histogram’s are super useful, but quite tricky to work with. Histogram heatmaps in grafana are super nice, but don’t forget about quantiles.
Ping dashboard
What I wanted from the dashboard was an easy, at a glance view of how bad the connectivity was over a period of time. Using the bucketed histogram option of Grafana is quite useful for that, as it will tell you how many pings happened in a particular backend of time/latency.
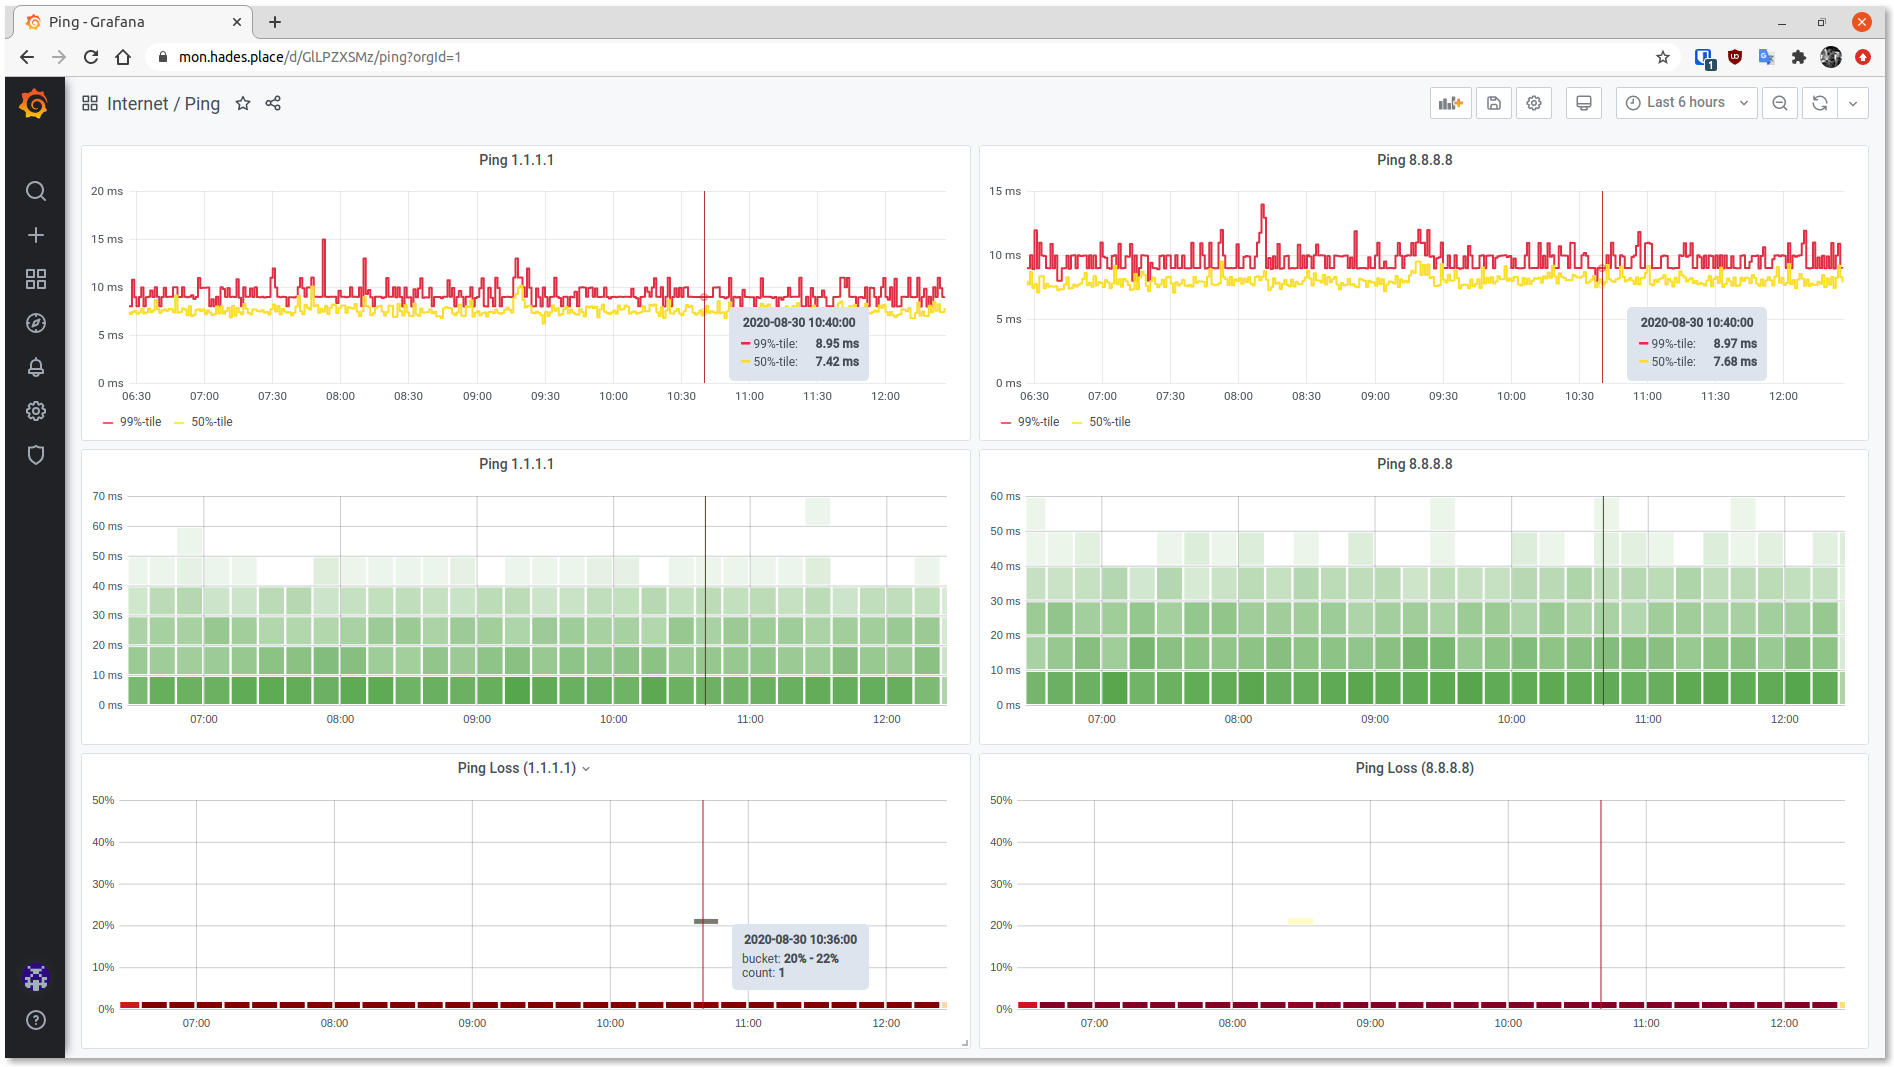
The ping ping dashboard showing a little a few lost packets to Cloudflare.
The source code for the dashboard is here. To use it, just Import it to Grafana.
Bandwidth dashboard
This is quite an easy dashboard showing just the bandwidth from the WiFi router.
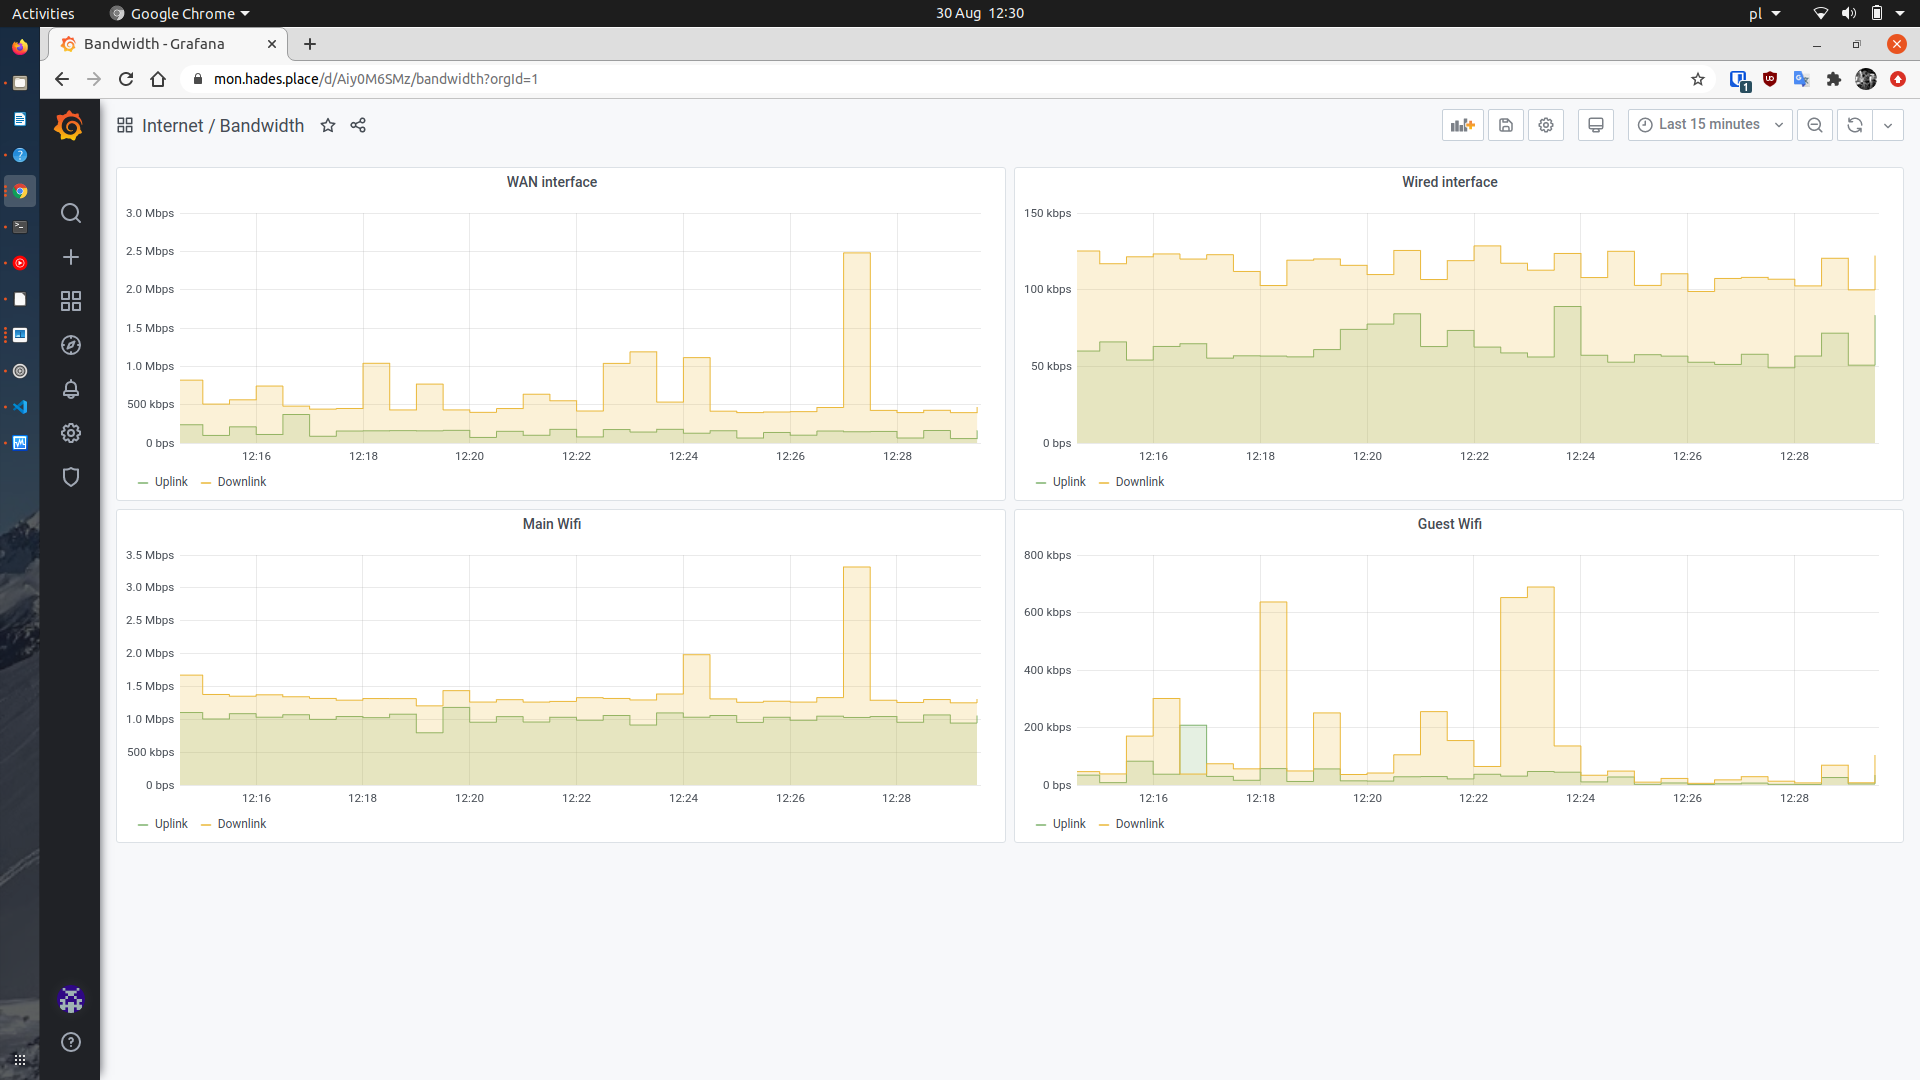
Bandwidth dashboard.
The source code for the dashboard is here. To use it, just Import it to Grafana.
Conclusion
The dashboard has been incredible useful to tee apart the impact of configuration on my work from home experience. With this I was able to tee off that the source of my problems have been the WiFi that came with the UPS box. After moving to my dedicated WiFi router, most of the problems went away.